+86 15633683072
To calculate automatic pipe welding productivity, measure the complete production cycle per accepted weld, including joint preparation, setup, welding, repositioning, inspection, and repair.
Productivity = Number of accepted welds ÷ Total production hours
For a fair comparison between manual and mechanized welding, use the same pipe dimensions, joint design, welding process, and acceptance criteria.
A track welding machine, magnetic carriage, or other mechanized system may improve travel consistency and reduce manual torch manipulation. However, the actual benefit depends on setup time, joint preparation, operator involvement, and production volume.
This guide explains how to calculate welding cycle time, compare manual and mechanized pipe welding, estimate costs, and evaluate welding automation return on investment.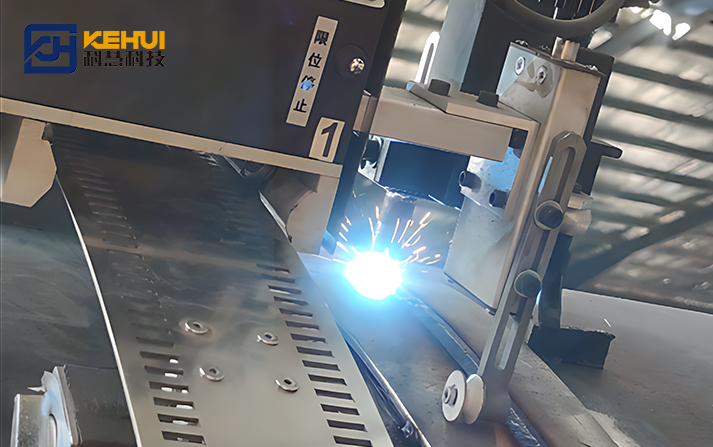
Comparing manual arc-on time with the travel time of an automatic system can produce misleading results. The correct comparison includes the complete production cycle for one accepted circumferential weld.
| Time component | What to record |
|---|---|
| Joint preparation and fit-up | Cleaning, bevel checks, alignment, root gap adjustment |
| Loading and clamping | Positioning and securing the workpiece |
| Equipment setup | Track installation, alignment, torch adjustment, parameter selection |
| Welding | Arc-on time for all required passes |
| Repositioning | Moving the carriage or resetting equipment between welds |
| Inspection and repair | Required inspection, defect correction, and reinspection |
For a magnetic track welder, record the time needed to attach the carriage, check its travel path, and verify stable operation. Magnetic attachment does not eliminate the need to assess surface condition, curvature, torch access, and travel stability.
[
T_{\text{cycle}}=
T_{\text{fit-up}}+
T_{\text{setup}}+
T_{\text{weld}}+
T_{\text{reposition}}+
T_{\text{inspection}}+
T_{\text{repair}}
]
Use the same time unit throughout, such as minutes per joint. If inspection or repair happens in parallel with other operations, distinguish elapsed cycle time from labor hours to avoid double counting.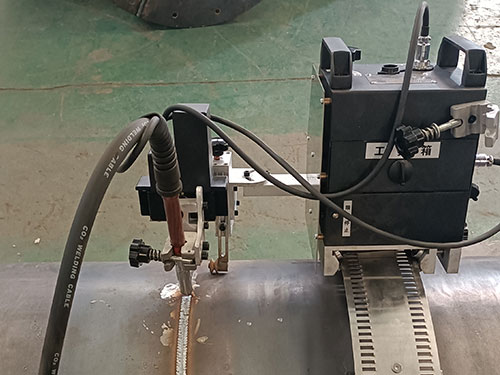
For a circular pipe weld path, the theoretical travel distance is:
[
L=\pi D
]
Where (L) is the circumference and (D) is the pipe outside diameter.
For a pipe with an outside diameter of 500 mm, the circumference is approximately 1,571 mm. At an effective travel speed of 100 mm/min, one pass would theoretically take:
[
T_{\text{pass}}=\frac{1571}{100}=15.7\text{ min}
]
This is only an estimate. Actual time may include arc starts and stops, overlap, crater treatment, and interruptions.
For a multipass circumferential weld, calculate each pass separately:
[
T_{\text{weld}}=\sum_{i=1}^{n}\frac{L_i}{v_i}
]
Here, (L_i) is the effective travel distance and (v_i) is the effective travel speed for each pass.
A track welding machine can maintain more consistent travel once correctly installed and adjusted, but stable travel speed alone does not guarantee penetration, fusion, or acceptable weld quality.
Actual cycle time also depends on:
Pipe diameter, wall thickness, and joint geometry
Welding process, position, and number of passes
Whether the pipe rotates or the welding head travels around a stationary pipe
Accessibility and repositioning requirements
Inspection and acceptance criteria
Use actual welding procedure data rather than applying one travel-speed assumption to every joint.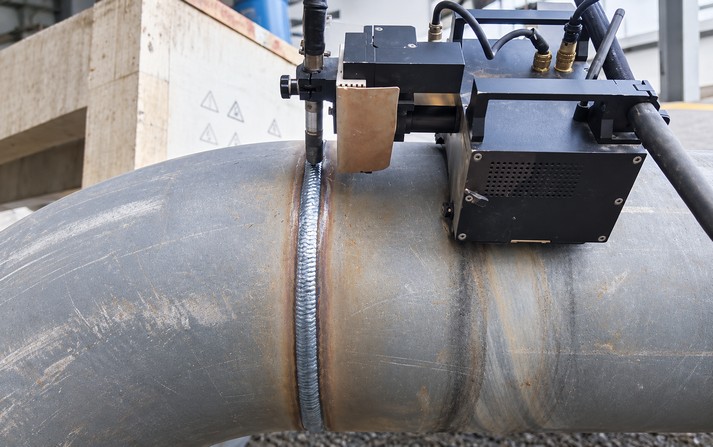
The following example uses hypothetical planning estimates, not KEHUI customer data or verified equipment test results.
Assume a factory produces 100 comparable pipe joints per month using the same joint design and acceptance criteria.
| Time per joint | Manual welding | Mechanized welding |
|---|---|---|
| Fit-up and preparation | 12 min | 12 min |
| Loading and clamping | 5 min | 5 min |
| Equipment setup | 2 min | 8 min |
| Welding | 35 min | 25 min |
| Repositioning | 4 min | 3 min |
| Inspection and repair allowance | 7 min | 5 min |
| Total cycle time | 65 min | 58 min |
The mechanized process takes longer to set up but less time to weld. The total cycle is reduced by 7 minutes.
[
\text{Cycle time reduction}=
\frac{65-58}{65}\times100%=10.8%
]
This result applies only to the assumptions in this example. It is not a universal productivity benchmark.
For an 8-hour shift, theoretical capacity is:
[
Q=\frac{60H}{T_{\text{cycle}}}
]
Where (H) is available production hours and (T_{\text{cycle}}) is minutes per accepted weld.
Manual: (480/65 \approx 7.38) joints per shift
Mechanized: (480/58 \approx 8.28) joints per shift
These are theoretical figures, not guaranteed output. Breaks, downtime, material shortages, and downstream inspection can reduce actual production.
The example demonstrates why automatic pipe welding productivity must be measured using complete cycle time. For a magnetic track welder, the benefit depends on how quickly it can be attached, aligned, tested, and moved between joints.
Different systems suit different workpieces and production layouts.
| Equipment type | Potential advantage | Main consideration |
|---|---|---|
| Manual welding | Flexible for varied joints and difficult access | Operator skill and consistency |
| Track welding machine | Guided, repeatable travel | Track installation and alignment |
| Magnetic track welder | Can reduce the need for a continuously installed conventional rail on suitable steel surfaces | Magnetic holding, surface condition, and curvature |
| Auto carriage welding machine | Reduces repeated manual torch manipulation | Setup, torch access, and supported functions |
| Rotating-workpiece system | Can maintain a controlled welding position for suitable parts | Loading, clamping, and rotation capacity |
A track welding machine is not automatically the best choice for every circumferential weld. A track-guided carriage may suit repeatable travel paths, while a magnetic system may be convenient on large steel structures where conventional track installation is difficult.
Before selecting a magnetic system, confirm the workpiece material, surface condition, curvature, and attachment stability. Also verify which functions the specific auto carriage welding machine supports. Automatic seam tracking, torch oscillation, and closed-loop control should not be assumed unless confirmed by the manufacturer.
Compare complete production cycles rather than purchase price or advertised travel speed alone.
[
H_{\text{labor}}=
\frac{\text{Total labor hours}}{\text{Accepted welds}}
]
Include the personnel needed for setup, operation, and other required tasks. If one operator supervises several stations, allocate their time across the stations instead of charging a full shift to each machine.
Elapsed cycle time and labor time are not necessarily equal. A machine may continue welding while an operator performs another task, provided the workflow and safety requirements allow it.
[
C_{\text{weld}}=
C_{\text{labor}}+
C_{\text{consumables}}+
C_{\text{energy}}+
C_{\text{equipment}}+
C_{\text{inspection}}+
C_{\text{repair}}
]
Labor cost can be estimated as:
[
C_{\text{labor}}=H_{\text{labor}}\times R_{\text{labor}}
]
Where (R_{\text{labor}}) is the factory's fully loaded labor rate per hour.
Equipment costs may include depreciation, maintenance, and replacement parts. Repair costs may include grinding, additional consumables, repeat inspection, and delays to downstream operations.
Compare the cost per accepted weld, not simply the cost of starting a weld. A shorter cycle may still be more expensive if repair rates or consumable use increase.
Automation investment should be assessed against realistic annual savings, not maximum theoretical capacity.
[
S_{\text{annual}}=
S_{\text{labor}}+
S_{\text{repair}}+
S_{\text{consumables}}-
C_{\text{additional}}
]
Include demonstrated savings from labor, repairs, and consumables, then subtract additional maintenance, training, and operating costs.
Do not automatically treat released labor time as cash savings. Savings become financial benefits when the factory can reduce overtime, avoid new hiring, redeploy labor productively, or generate additional profitable output.
[
\text{Payback period}=
\frac{\text{Initial investment}}{\text{Annual net savings}}
]
Initial investment may include equipment, fixtures, installation, training, and required production-line changes.
Illustrative example only:
| Item | Assumed value |
|---|---|
| Initial equipment and installation investment | $30,000 |
| Annual labor and repair savings | $12,000 |
| Additional annual operating costs | $2,000 |
| Annual net savings | $10,000 |
| Simple payback period | 3 years |
Calculation: $30,000 ÷ $10,000 = 3 years.
These figures are not KEHUI equipment prices or customer results. Simple payback is a screening method; major investments may also require cash-flow, financing, and equipment-life analysis.
For a simplified break-even estimate:
[
N_{\text{break-even}}=
\frac{C_{\text{annualized investment}}}
{C_{\text{manual per weld}}-C_{\text{mechanized per weld}}}
]
This formula is useful only when mechanized welding has a lower comparable cost per accepted weld. Annual utilization, setup time, and maintenance must be included in the cost assumptions.
Before buying a track welding machine or another mechanized system, test it on representative workpieces.
Select a representative joint. Match normal pipe diameter, wall thickness, material, joint design, welding position, and acceptance criteria.
Record the existing process. Measure fit-up, clamping, welding, repositioning, inspection, and repair separately.
Test the mechanized process. Include track installation or magnetic attachment, alignment, torch adjustment, and dry-run time.
Inspect the finished welds. Apply the same approved welding procedure and acceptance requirements to both processes.
Repeat the trial. Record average performance and variation across representative joints instead of relying on the fastest cycle.
Find the actual bottleneck. If fit-up or inspection limits production, increasing carriage speed may not increase overall output.
This approach gives a more reliable estimate of automatic welding carriage productivity than relying on catalog travel speeds alone.
For a related equipment selection framework, see How to Choose an Automatic Girth Welding Machine. For a practical comparison of production performance, see Efficiency Test of Automatic Welding Tractor for Pressure Vessel Circumferential Seam Welding.
Comparing arc-on time with total cycle time: Include setup and handling for both methods.
Ignoring repair and inspection: Calculate cost per accepted weld.
Assuming one operator per machine: Allocate labor based on actual duties and safe operating requirements.
Treating theoretical capacity as actual output: Account for downtime, material flow, and changeovers.
Assuming magnetic attachment works on every surface: Verify material, surface condition, and stability.
Overestimating annual utilization: Low machine usage can extend payback significantly.
Treating automation as a substitute for process control: Joint preparation, welding parameters, and inspection remain essential.
Divide accepted welds by total production time. For investment decisions, also calculate cycle time per joint, labor hours, repair rate, and cost per accepted weld.
No. It may improve travel consistency and reduce manual torch-control work, but setup and repositioning can offset the time saved. Actual performance depends on the joint and production workflow.
It may be suitable for large steel structures where magnetic attachment is reliable and conventional track installation is inconvenient. Verify material compatibility, surface condition, curvature, and travel stability.
Cycle time measures elapsed production time. Labor time measures the combined time contributed by personnel. They differ when an operator can safely perform other tasks while the machine runs.
There is no universal percentage. Measure representative joints under comparable conditions and use complete cycle data, repair rates, and actual operating costs.
Record initial investment, annual production volume, labor rates, repair costs, operating expenses, maintenance, and realistic machine utilization.
Reliable welding productivity calculations combine total cycle time, labor hours, repair rates, cost per accepted weld, and equipment utilization.
A track welding machine, magnetic track welder, or auto carriage welding machine can improve production when its capabilities match the joint and workflow. The best option is the one that produces acceptable welds at a lower total cost under real operating conditions—not necessarily the machine with the highest advertised travel speed.
Start with measured baseline data, run a comparable production trial, and calculate payback using realistic annual savings. This gives engineering and purchasing teams a practical basis for evaluating automatic pipe welding productivity.
Zhengzhou Kehui Technology Co., Ltd
Email: info@zzkehui.com





 Chinese
 English
 OA
 Current location:
 Concrete Mixer Drum Robotic Welding Solutions
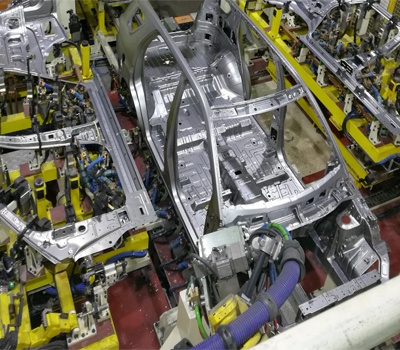 Automobile Body Production Line Welding Fixtures
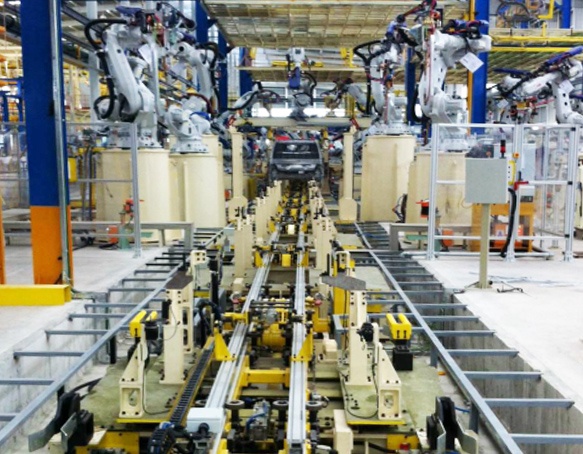 Automotive Body Welding Automated Manufacturing Solutions
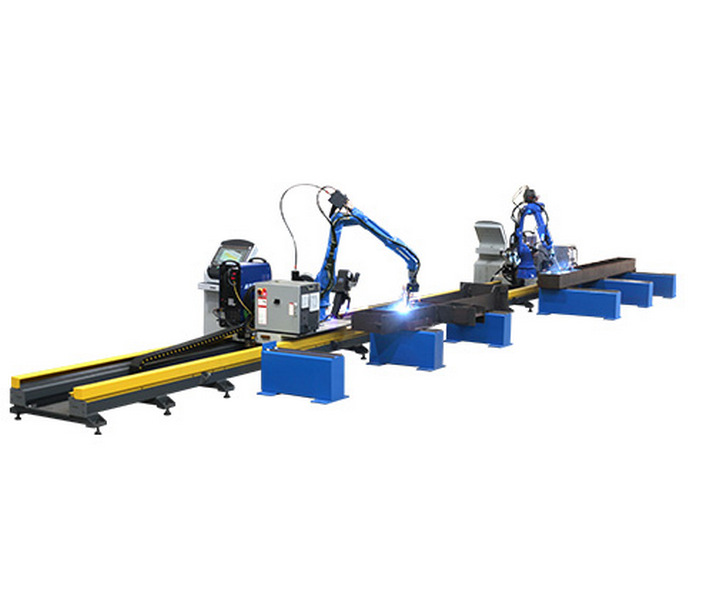 Free-Teaching Programming Welding Robot Cell For I Beam Welding
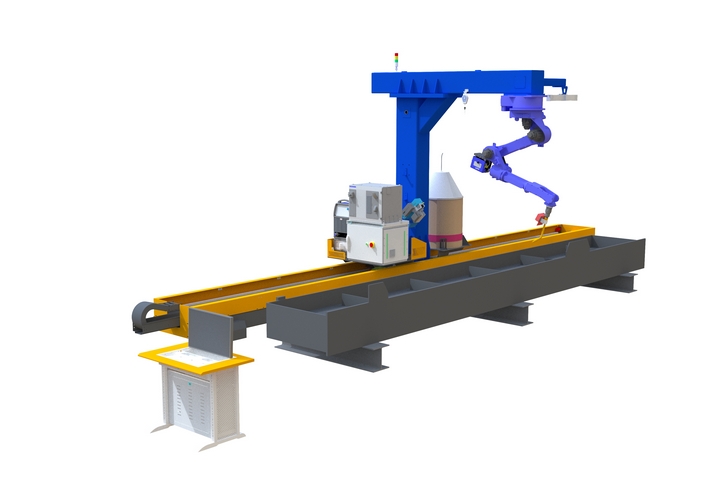 No Programming Required Robotic Welding Systems for H beam Welding Line