+86 15633683072
Soft spots after quenching are rarely a furnace problem. They are usually a cooling problem—more specifically, a vapor blanket problem. But “usually” is not a diagnosis. This article sets out a troubleshooting sequence for the heat treatment quenching process: separate heating-side from cooling-side causes, isolate the vapor blanket and agitation variables, check the quenchant's chemical state, and confirm with a cooling curve rather than a single hardness reading.
The instrument used for confirmation is a quenchometer—a probe-based cooling curve tester built to ISO 9950 or ASTM D6200. The KHR-A Quenchometer discussed below is one such instrument; it is not a hardness tester and does not replace metallography. It measures the medium, the one variable in the soft-spot chain with no automatic record.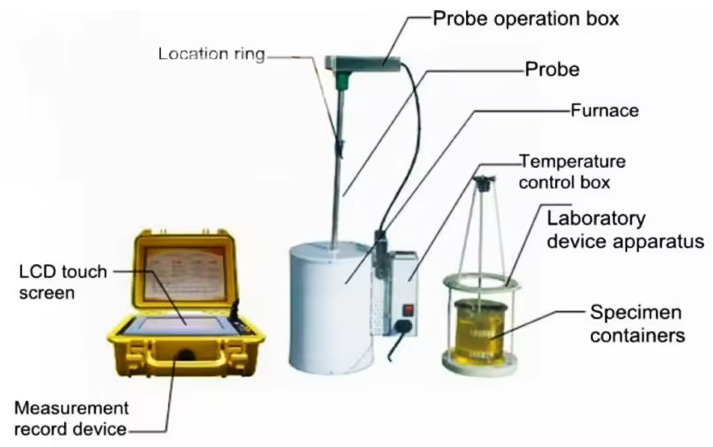
The distribution of soft spots after quenching carries diagnostic information a single low hardness reading does not.
Fixed-position soft spots. The same locations on every part—the underside of a head, a recess, a face shielded from the agitator. This points toward vapor blanket retention or flow shadowing, not a furnace fault.
Random, scattered soft spots across a load. No repeatable location. This points toward a bulk change in the quenchant—water contamination, concentration drift, degradation—or a load-wide agitation shortfall.
Uniformly low hardness on every part. This is not a soft spot in the metallurgical sense. Over-tempering or insufficient hardenability lowers hardness evenly; a soft spot is a local failure to transform.
A mapped hardness survey across multiple parts from different load locations is the correct first step.
Both heating and cooling can leave non-martensitic products—bainite, fine pearlite, or ferrite where martensite was intended—but the process signature differs.
On the heating side, the causes are furnace temperature non-uniformity, soak time counted from charge rather than from reaching temperature, over-dense loading, or a grade that cannot through-harden the section. Scale, drawing lubricant, or rust acting as an insulating film prevents wetting.
On the cooling side, the dominant mechanism is the vapor blanket stage. A hot part entering a liquid quenchant wraps itself in a stable vapor film. Heat transfer during this stage is slow, occurring primarily by radiation through the vapor. The blanket is stable, and its removal is enhanced only by agitation or speed-improving additives. Where it persists, the surface cools too slowly through the transformation range, and non-martensitic transformation products form. The literature on the heat treatment quenching process states this directly: the vapor stage is responsible for many surface soft spots.
The vapor film does not collapse evenly. It clings to recesses, undersides of horizontal surfaces, and anywhere flow is dead—and wherever it holds longest, that area cools slowly enough to miss the transformation it was supposed to make.
Agitation coverage, not agitation power. Agitation in the vapor stage is mechanical: it disrupts the film and promotes earlier collapse. Inadequate quench agitation delays rupture of the vapor blanket on some surfaces, lowering the local cooling rate and allowing high-temperature transformation products to form. But “more agitation” is not automatically the answer—excessive spray pressure can cause foaming and uneven flow, and improper agitation can produce soft spots, distortion, and a “barber pole” response. The useful question is whether flow reaches every wetted surface, including blind holes and spaces between nested parts.
Loading and racking. Parts nested, stacked, or packed too densely can trap a steam or gas film between surfaces, preventing liquid contact at the critical moment.
Bath temperature. For water-based and PAG solutions, bath temperature above roughly 45 °C lengthens the vapor stage and raises soft-spot risk. For oil, excessive temperature changes viscosity and cooling characteristics.
If the soft-spot pattern is fixed and tracks a geometric feature or loading position, the correction belongs here—before any quenchant chemistry is suspected.
Once geometry and flow are ruled out, the medium itself becomes the suspect.
PAG concentration drift. Polyalkylene glycol quenchants achieve their cooling rate through concentration, temperature, and agitation. Higher concentration lowers the maximum cooling rate and convection-phase cooling rate—useful when a slower, crack-safe quench is wanted, but an unexpectedly high concentration can leave a section under-cooled. A published case of induction-hardened cylinders found soft spots on a small percentage of parts quenched with a high concentration of PAG; reducing concentration increased quench speed and addressed the soft spots. A refractometer reading does not prove the bath is delivering the intended cooling path.
Water contamination in oil. Water in quench oil changes the cooling curve, and the thresholds are low. Above 0.05%, parts can develop soft spots and distortion; above 0.1%, cracking and failure become a real risk; at around 1%, water at the tank bottom can flash to steam and overflow the bath. A small water content can alter the cooling curve without necessarily producing a visible change in the oil. Karl Fischer titration (ASTM D6304) or distillation (ASTM D95) confirms water content; the cooling curve shows what that water is doing to the quench path.
Sludge, varnish, and oxidation products. Oil degradation manifests as viscosity increase, acidity increase (Total Acid Number), varnish and lacquer deposits, and changes in quench speed. These deposits can insulate surfaces or alter heat transfer, and they can change the shape of the cooling curve in ways a single “quench speed” number does not reveal.
The remaining question is which of these has actually moved the cooling behavior—and that is the question a quench oil testing program with a cooling curve at its center answers.
A quenchometer records the temperature–time history of a standard probe quenched into the medium. Under ISO 9950 and ASTM D6200, the probe is an Inconel 600 cylinder, 12.5 mm × 60 mm, with a Type K thermocouple at its geometric center, heated to the austenitizing temperature and quenched into a fixed volume of test medium at a controlled bath temperature.
The diagnostic value for soft spots after quenching lies in what the curve reveals that a hardness reading cannot:
Vapor-stage duration and characteristic temperature. An abnormally long vapor blanket stage, or a characteristic temperature shifted downward, means the medium and agitation are keeping the part “inside the vapor” longer—the mechanistic precursor to a soft spot. A single maximum-cooling-rate number can look acceptable while vapor-stage behavior has already drifted.
Curve shape anomalies. A double peak, a step in the boiling-stage slope, or an unusual separation between vapor and boiling stages can indicate contamination, stratification, or concentration loss—visible on the curve, invisible in a single endpoint time.
Baseline overlay. A curve compared against the same tank's earlier curve shows direction and magnitude of change. “This oil is still within the supplier's speed band” is weaker than “this oil's vapor stage has lengthened measurably since the last baseline.”
A quenchotest—the general category of portable cooling curve measurement—is often treated as a laboratory exercise. In practice, soft-spot diagnosis is most useful when the curve is taken at the tank, with the same agitation and bath temperature the parts actually see. A curve taken on-site against a stored baseline turns a one-time investigation into a quenching monitoring system.
The KHR-A Quenchometer is built for this step. It is manufactured to ISO 9950, supports testing in line with ASTM D6200 and ISO 9950, records at up to 1,000 readings per second with a measurable maximum cooling rate of 2,000 °C/s and ±1 °C temperature control, and outputs maximum cooling rate and its temperature, cooling rate at 300 °C, upper and lower characteristic temperatures, and time to reach 600/400/200 °C. It stores up to 64 results and overlays four curves on one chart. A smart quenching tester in this sense makes the comparison between “then” and “now” the primary output, not the software itself.
| Observation | More likely direction | Cooling curve signal to check | Next action |
|---|---|---|---|
| Soft spots at fixed positions—recesses, undersides, contact faces | Vapor blanket retention / flow shadowing | Vapor-stage duration may be normal on a single probe; local flow is the suspect | Change racking or agitation direction first; re-survey hardness before replacing medium |
| Random soft spots across a load | Bulk medium change or load-wide agitation loss | Vapor-stage lengthening, characteristic temperature shift, curve-shape anomaly | Run a quench oil testing panel: water content, concentration, and cooling curve against baseline |
| PAG bath, hardness below target, concentration reading “in range” | Refractometer reading may not reflect cooling behavior | Maximum or high-temperature cooling rate has shifted | Verify with a cooling curve before adjusting concentration |
| Oil bath, random soft spots and staining | Water contamination | Vapor/boiling-stage curve shape altered | Karl Fischer or distillation for water; cooling curve to confirm effect on quench path |
| Oil bath, sludge or varnish present | Degradation products altering heat transfer | Curve shape change, altered boiling-stage slope | Condition monitoring plus cooling curve; sludge removal alone does not restore the curve |
| Soft spots persist after medium change | Vapor blanket/flow still not corrected, or heating-side variable remains | Curve may have moved toward baseline without reaching it | Return to Step 3 and re-verify furnace uniformity |
Read the table by the pattern you observed, not by the instrument you own. A shop that replaces the quenchant before checking racking and flow has skipped the cheapest part of the diagnosis.
The KHR-A Quenchometer is manufactured by Zhengzhou Kehui Technology (Kehui Group), founded in 1994. Kehui's founder is a technical specialist in this field, and the company was the first domestic Chinese manufacturer to independently develop and manufacture quenching medium cooling performance testers. The KHR-A carries patent ZL 2008 2 0069148.0 and is designed for oil, polymer, water-based, salt, and gas quenching media. Kehui's quenching detectors have covered approximately 95% of the Chinese domestic market, with an installed base spanning chemical, boiler, pressure vessel, engineering machinery, military, and nuclear power applications. With export capability, Kehui is extending the KHR-A Quenchometer into international markets where heat treaters are moving from single-number screening toward curve-based control of the heat treatment quenching process.
For a shop diagnosing soft spots after quenching, the relevant claim is narrow: the KHR-A is a quenchometer that produces a cooling curve at the tank, against a stored baseline, with output parameters that correspond to vapor-stage behavior and low-temperature cooling. It does not diagnose the soft spot for you. It gives the diagnosis a cooling-side measurement where previously there was only a recollection that “the oil seemed fine.”
No. Vapor blanket retention from racking or agitation, surface scale or lubricant preventing wetting, and insufficient hardenability can all produce soft spots with a serviceable quenchant. The diagnostic sequence puts geometry and loading before chemistry for that reason.
Industry guidance places the soft-spot and distortion threshold above 0.05%, and cracking/failure risk above 0.1%. At around 1%, water at the tank bottom can flash to steam and overflow the bath. Karl Fischer titration (ASTM D6304) or distillation (ASTM D95) is the standard quench oil testing method; the cooling curve shows the effect on the quench path.
A quenchometer measures the medium, not the part. It shows whether the medium's cooling curve—vapor-stage behavior, maximum cooling rate, 300 °C cooling rate, characteristic temperatures—has moved away from the condition that previously produced sound parts. That is the cooling-side measurement hardness testing and visual inspection cannot provide.
In common usage, both refer to cooling curve measurement of a quenchant. A quenchotest generally describes the portable, probe-based test; a quenchometer is the instrument that performs it. A GM Quenchometer (ASTM D3520) is a different method that measures a single Curie-point time and does not produce a cooling curve.
A smart quenching tester in the KHR-A sense emphasizes baseline comparison and tank-side decision output: stored results, curve overlay, and direct readout of parameters tied to vapor-stage and low-temperature behavior. The value is the ability to see whether the curve has moved since the last good production period.
No. It complements it. Laboratory testing covers water content, viscosity, acid number, and sludge. The cooling curve shows what those indicators are doing to the quench path. A quenching monitoring system combining condition monitoring with a tank-side cooling curve closes the loop.
Soft spots after quenching are a symptom with more than one cause. The order of investigation matters because the cheapest corrections—racking, agitation coverage, bath temperature—come before the most expensive one, replacing or reconditioning the medium. The cooling curve enters where the physical checks are done and the question becomes “has the medium actually moved?” That is the question a quenchometer is built to answer, and it separates a soft-spot investigation from a medium-replacement guess.
If you are working through a soft-spot problem and have already checked loading, agitation, and furnace uniformity, send us the quenchant type, the bath's last quench oil testing results, and the soft-spot pattern you observed. We will tell you what the cooling curve should be checked against—not simply quote an instrument.
Zhengzhou Kehui Technology Co., Ltd
Email: info@zzkehui.com





 Chinese
 English
 OA
 Current location:
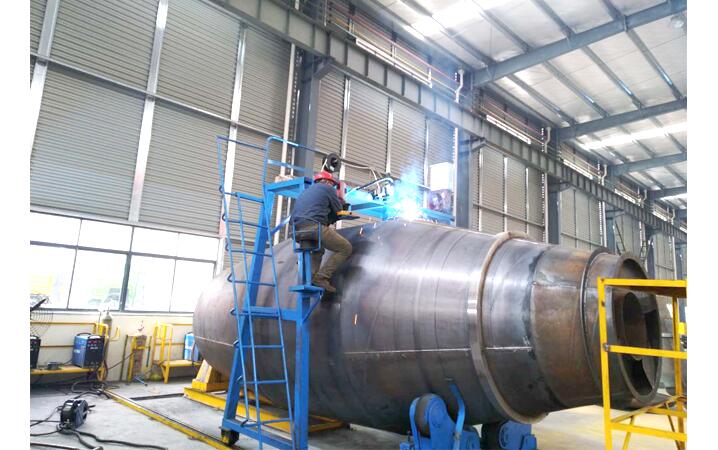 Concrete Mixer Drum Robotic Welding Solutions
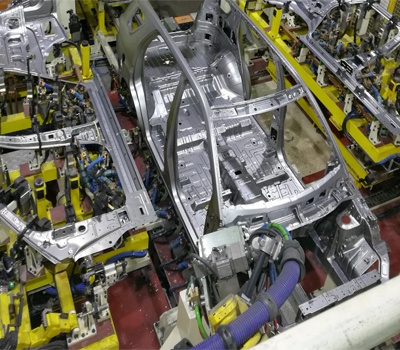 Automobile Body Production Line Welding Fixtures
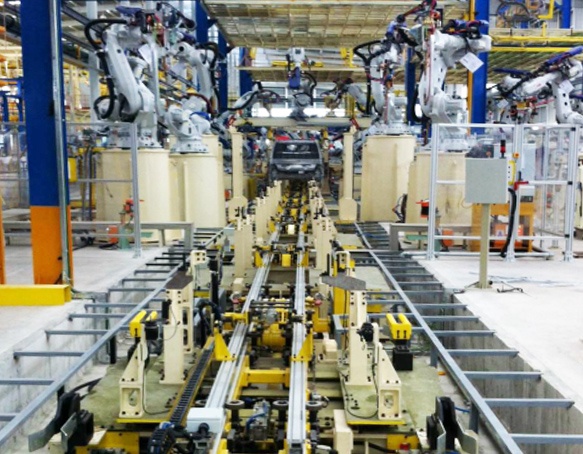 Automotive Body Welding Automated Manufacturing Solutions
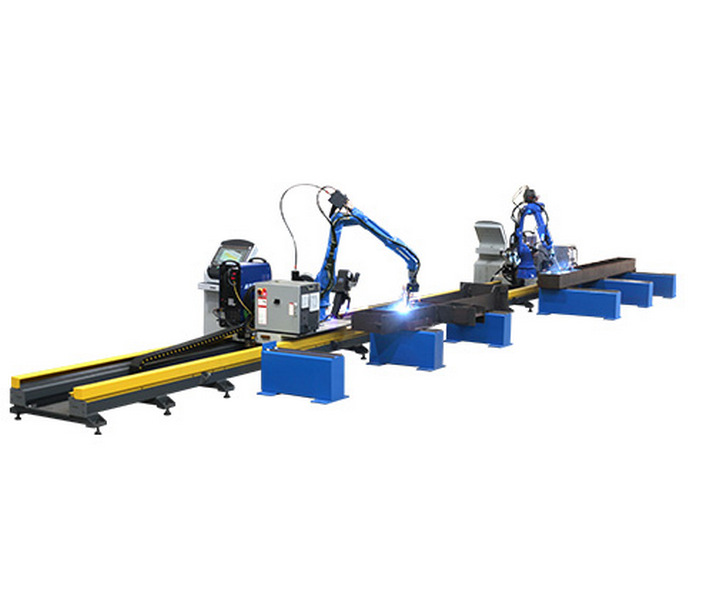 Free-Teaching Programming Welding Robot Cell For I Beam Welding
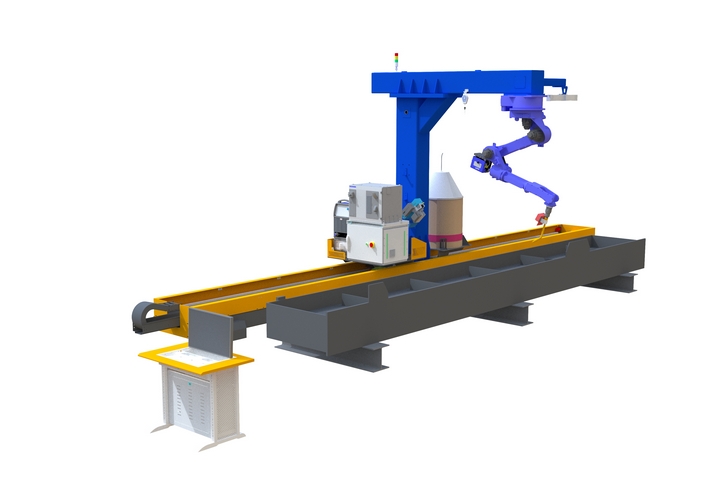 No Programming Required Robotic Welding Systems for H beam Welding Line